From an Economic Question to a Local Projection
Lecture 01
In late June 1950, North Korean forces crossed into South Korea. Within weeks, American newspapers and business magazines were reporting plans for a large and lasting rise in military spending. Ramey’s narrative series prices such reports as the change in the expected present value1 of government spending (Ramey, 2011). For the third quarter of 1950 it records news worth 179.4 billion dollars, which is 0.600 of the previous quarter’s nominal trend GDP2 at an annual rate (Ramey and Zubairy, 2018). A policymaker reading those reports would want to know what the buildup would do to output over the next three years.
The path that followed is easy to read. Real GDP stood 2.75 percent below trend in 1950Q2 and 5.12 percent above it in 1953Q1, ten quarters after the news arrived: a rise of 7.87 points of trend GDP. It is tempting to call those 7.87 points the effect of the news. Many other things happened in the same quarters, though. Taxes rose; in the postwar tax record assembled by Romer and Romer (2010), the largest increases motivated by spending came during the Korean War. The March 1951 Treasury–Federal Reserve Accord3 freed monetary policy. Wage and price controls were imposed in January 1951 and dismantled early in 1953 (Rockoff, 1984). The rise of 7.87 points mixes the news with all of these.
So the question is not what happened next. It is what happened because of the news, and answering it requires a path nobody observed: the one GDP would have followed had the news not arrived, with everything else as it was. This lecture turns that comparison into a regression. We start in an economy small enough that the unobserved path can be computed exactly and derive a regression whose coefficient recovers the comparison there. Then we build that regression’s rows by hand and return to the quarterly data with one estimated response and a list of what it has not yet earned.
By the end of the lecture, you should be able to:
- define the causal response at horizon h as the gap between the realized path and the path without the intervention, and distinguish it from the change since the date before the intervention;
- iterate y_t=\rho y_{t-1}+\theta_0 s_t+v_t forward to derive \theta_h=\theta_0\rho^h, and show that the horizon-h regression of y_{t+h} on a constant, s_t, and y_{t-1} has \beta_h=\theta_h, \gamma_h=\rho^{h+1}, and a residual built from disturbances dated t through t+h and shocks dated t+1 through t+h;
- build the regression rows for h=0,1,2 by hand, state T_h=T-h-p, and compute \hat\beta_h from those rows;
- estimate \hat\beta_h for h=0,\dots,H in a Stata loop that stores \hat\beta_h and T_h, and draw a response graph whose caption names the intervention, the units, and the counterfactual; and
- explain what one estimated coefficient measures and where its variation comes from, why a single episode cannot identify it, and which claims a first data application has not yet earned.
The lecture assumes ordinary least squares (the slope as a covariance over a variance, and the slope on a 0–1 regressor as a difference in means), expectation and independence, and elementary Stata: tsset, time-series operators, loops, regress, and stored results. No time-series course is assumed; the one autoregression we need is built from scratch and iterated by hand. Standard errors, instruments, and vector autoregressions come later.
1 The Question: An Intervention, an Outcome, and a Path We Never See
The Korean episode has three parts that recur in every problem of this course. Something happens at a date: news arrives, a policy rate moves, a state changes its banking law. An outcome is measured at that date and afterwards. And the question compares that outcome with what it would otherwise have been. The first two parts can be measured. The third cannot, and an economy small enough to compute by hand shows why no single observed path supplies it.
1.1 Intervention, Outcome, and Two Paths
Write s_t for the intervention variable dated t and y_t for the outcome. In the opening, s_t is a quarter’s military news measured as a fraction of trend GDP, and y_t is real GDP divided by trend GDP. The name is deliberately neutral. Calling s_t a shock would claim that nothing else systematically moves with it, and that claim needs an argument, which Lecture 3 supplies. Until then s_t is simply the variable whose effect we want.
The data record one sequence of outcomes, the realized path. It carries the effect of s_t together with the effect of every other disturbance that arrived before and after. The counterfactual path, written y^{c}_t, is the sequence the same economy would have produced without the intervention at date t and with every other disturbance exactly as it was. The superscript c marks counterfactual objects throughout the course. Nobody observes y^{c}_t.
The causal response h periods after the intervention is the gap between the two paths at the same date:
\theta_h=y_{t+h}-y^{c}_{t+h}. \tag{1}
Read Equation 1 across, not down the calendar. Both terms are dated t+h, so the equation compares two versions of one period, not one period with an earlier one. The units of \theta_h are the units of y; when the intervention is a one-unit change in s_t, they are units of y per unit of s. In the Korean example the gap would be measured in points of trend GDP. The response carries no date subscript here because, in the economies of this lecture, the gap does not depend on when the intervention arrives; Section 2 and Section 3 show why. This is the sense in which Stock and Watson (2018) define dynamic causal effects in macroeconomics: a comparison of the outcomes that would follow different values of the intervention, not a description of what followed the one value that occurred.
1.2 The Change Since the Date Before
The number the opening read off the data was a different object: the change in the realized path since the period before the news, y_{t+h}-y_{t-1}. To see how it relates to \theta_h, add and subtract y^{c}_{t+h}:
y_{t+h}-y_{t-1} =\underbrace{\bigl(y_{t+h}-y^{c}_{t+h}\bigr)}_{\theta_h} +\underbrace{\bigl(y^{c}_{t+h}-y_{t-1}\bigr)}_{\text{change without the intervention}}. \tag{2}
The first bracket is the causal response. The second is the change the economy would have made anyway, driven by everything except the intervention. The left side of Equation 2 equals \theta_h only when the second bracket is zero, that is, only when the counterfactual path would have stayed at its pre-intervention level. Nothing guarantees that. A wartime economy with rising taxes, a newly independent central bank, and price controls had many reasons to move.
The decomposition relies on one fact about timing. An intervention at t cannot change y_{t-1}, so the realized and counterfactual paths coincide before t and the same y_{t-1} appears in both brackets. If people act on news before it is recorded, that fact fails; Lecture 3 treats the consequences under the name of anticipation.
1.3 A Twelve-Period Economy Where the Counterfactual Is Known
To watch the two objects diverge with actual numbers, we need an economy in which the counterfactual can be computed. Take twelve periods and the rule
y_t=0.5\,y_{t-1}+s_t+v_t,\qquad t=1,\dots,12,\qquad y_0=0.
Each period’s outcome is half of the previous outcome, plus the intervention, plus a disturbance4 v_t that stands for everything else. The intervention is binary: s_t=1 in a period when it occurs and 0 otherwise. Both inputs were drawn once in Stata with seed5 1. Each v_t is a standard normal draw rounded to one decimal, and each s_t is an independent draw equal to one with probability 0.3. The interventions happen to fall at t=1,5,10,12. Section 3 returns to this rule with general coefficients; here it only has to generate numbers.
Table 1 lists the draws and the realized path. To build the counterfactual for the intervention at t=5, set s_5=0, hold every v_t at its drawn value, and run the rule again.
| t | s_t | v_t | y_t | y^{c}_t | y_t-y^{c}_t | y_t-y_4 |
|---|---|---|---|---|---|---|
| 1 | 1 | 0.9 | 1.9000 | 1.9000 | 0 | — |
| 2 | 0 | 0.5 | 1.4500 | 1.4500 | 0 | — |
| 3 | 0 | 0.6 | 1.3250 | 1.3250 | 0 | — |
| 4 | 0 | −0.6 | 0.0625 | 0.0625 | 0 | 0.0000 |
| 5 | 1 | −1.7 | −0.6688 | −1.6688 | 1 | −0.7313 |
| 6 | 0 | 0.2 | −0.1344 | −0.6344 | 0.5 | −0.1969 |
| 7 | 0 | 2.1 | 2.0328 | 1.7828 | 0.25 | 1.9703 |
| 8 | 0 | −1.3 | −0.2836 | −0.4086 | 0.125 | −0.3461 |
| 9 | 0 | 0.8 | 0.6582 | 0.5957 | 0.0625 | 0.5957 |
| 10 | 1 | 0.6 | 1.9291 | 1.8979 | 0.03125 | 1.8666 |
| 11 | 0 | −0.9 | 0.0646 | 0.0489 | 0.015625 | 0.0021 |
| 12 | 1 | 1.5 | 2.5323 | 2.5245 | 0.0078125 | 2.4698 |
Before period 5 the two paths are identical, as the timing argument requires. At t=5 the realized outcome is y_5=0.5(0.0625)+1-1.7=-0.66875, while the counterfactual is y^{c}_5=0.5(0.0625)+0-1.7=-1.66875. The gap is exactly one: the intervention added one unit. Yet the realized outcome fell by 0.73125 from y_4=0.0625, because a disturbance of -1.7 arrived in the same period.
From then on the gap halves every period. At t=6 both paths carry forward half of their own previous value and receive the same v_6=0.2, so the only difference left is half of the previous gap, 0.5\times1=0.5. At t=7 the gap is 0.25 and at t=8 it is 0.125. The change since t=4 behaves erratically by comparison: -0.196875, then 1.9703125, then -0.34609375. Figure 1 shows both comparisons.
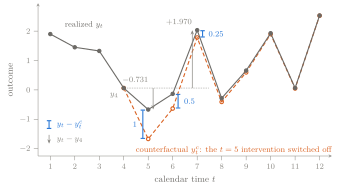
Equation 2 accounts for the difference exactly. At t=7 the realized change of 1.9703125 splits into the causal response 0.25 and a counterfactual change y^{c}_7-y_4=1.7828125-0.0625=1.7203125, which the disturbance v_7=2.1 more than accounts for. Reading the realized change as the effect would overstate the effect nearly eightfold at t=7 and get its sign wrong at t=5. Exercise 1 rebuilds the counterfactual path by hand.
Two features of the example will be needed again. First, the gaps 1, 0.5, 0.25, 0.125 do not depend on any v_t. Change the disturbances and the realized path moves, but the gap sequence does not. Second, the gaps were computable only because we knew the rule and every disturbance. With real data neither is available, so the counterfactual has to be reconstructed from other information. The rest of the lecture is about how a regression does that, and about what it has to assume.
A regression will not switch off one intervention; it pools many. Pooling forces a choice that the table could avoid: how to date a gap.
2 Two Clocks
A statement such as “the response at t=7 is 0.25” hides that choice. It could be a fact about period 7, or a fact about what happens two periods after an intervention. In the twelve-period economy the readings coincide because only one intervention was switched off. They separate as soon as a second intervention is considered.
2.1 Calendar Time and Horizon
Calendar time t is the date of an observation: a quarter such as 1950Q3, or a period in a simulation. In this course it also dates the intervention and, later, the regression row built around it. The horizon h counts the periods after the intervention at which the outcome is measured, so y_{t+h} is read “the outcome h periods after date t.” The horizon is measured in the data’s own periods: quarters in the Ramey–Zubairy data and abstract periods in the simulations. The opening’s 1953Q1 is horizon 10 for news dated 1950Q3.
The response at h=0 is the impact response, the effect within the period of the intervention. In the twelve-period economy it is the gap of 1 at t=5. Horizons count upward to a largest horizon H chosen by the researcher: H=2 for the hand calculations of Section 6, H=12 for the simulations, and H=20 quarters for the military-news data.
Now switch off the intervention at t=10 instead of the one at t=5, again holding every v_t fixed. The gaps at t=10,11,12 are 1, 0.5, and 0.25. On the calendar these are new numbers at new dates. On the horizon clock they are the same numbers as before: 1 at h=0, 0.5 at h=1, 0.25 at h=2. The rule treats an intervention the same way whenever it arrives, so the gap depends on the horizon and not on the date. That property is what allows a single sequence \theta_0,\theta_1,\dots to describe the response to every intervention in a sample. It is an assumption about the economy, stated formally as A1 below; if the effect of news depended on the state of the economy, the response would carry a date as well, which is the subject of Lecture 9.
2.2 The Impulse-Response Function
The sequence of causal responses read as a function of the horizon,
h\longmapsto\theta_h,\qquad h=0,1,\dots,H,
is the impulse-response function. It answers “how does the effect evolve after the intervention?” with a curve rather than a number. In the twelve-period economy the curve starts at 1 and halves each period.
The two clocks sort the objects of this course into two kinds. The realized path of GDP after 1950Q3 is a function of calendar time and belongs to one episode. The impulse-response function is a function of horizon and describes what an intervention does whenever it happens. The rise of 7.87 points was a calendar-time fact about 1950–1953. The policymaker’s question was a horizon-time question.
The distinction has a practical consequence. A regression that estimates the response at one horizon returns one number, so it estimates one point on the curve. Drawing the whole curve takes one estimate per horizon, and each estimate uses its own rows of data, a fact that Section 6 makes concrete. Before estimating anything, though, we need to know what the curve looks like in an economy where it can be derived rather than simulated.
3 The Smallest Model
The twelve-period economy produced a gap that halved every period and ignored the disturbances. Neither fact was an accident of the draws. Both follow from the rule, and seeing why requires writing the rule with general coefficients. The model we use is the smallest one in which an intervention has a response that unfolds over time and in which that response can be derived exactly.
3.1 An Autoregression with an Observed Shock
Let the outcome follow
y_t=\rho\,y_{t-1}+\theta_0 s_t+v_t . \tag{3}
Read Equation 3 from left to right as a recipe for this period’s outcome: carry forward the fraction \rho of last period’s outcome, add \theta_0 units for each unit of the intervention, and add the disturbance v_t. A series that equals a linear function of its own past plus new disturbances is an autoregressive process; this one is first order, written AR(1), because a single lag of y appears. The coefficient \rho measures persistence, the share of any deviation of y that survives into the next period, and it has no units. The coefficient \theta_0 is the impact response, in units of y per unit of s. The twelve-period economy is the case \rho=0.5 and \theta_0=1.
The intervention s_t is drawn independently each period with mean zero and standard deviation \sigma_s. The disturbance v_t is drawn the same way, with mean zero and standard deviation \sigma_v measured in units of y. The two sequences are independent of each other. Generated this way, s_t is an observed shock: a variable we measure directly, that cannot be predicted from the past, and that is independent of every other disturbance moving the outcome. In a simulation this holds by construction. For the military-news series it is a claim, and Lecture 3 examines what would make it believable. (The binary intervention of the twelve-period economy has mean 0.3 rather than zero; a nonzero mean changes only the regression intercept, as Section 4 notes.)
The derivations below use four assumptions. Each is stated once here and cited by number where it does its work.
A1 (Linear, time-invariant dynamics). The outcome follows Equation 3 with the same \rho and \theta_0 at every date. Meaning. An intervention of a given size has the same effect whenever it arrives, and the effects of interventions and disturbances add up. Used in. The forward substitution Equation 4, the response formula Equation 5, and the date-free reading of the response in Section 2. Without it. The gap between paths depends on the date, the state of the economy, or the size of the intervention, so no single sequence \theta_h exists; a regression coefficient then averages different responses with weights the researcher did not choose (Lectures 9 and 10). Kind. A modeling convenience in the simulations and an empirical claim in data.
A2 (Unpredictable intervention). The interventions \{s_t\} are independent over time and identically distributed, with mean zero and variance \sigma_s^2>0. Meaning. Nothing in the past, including past interventions, helps forecast today’s intervention, and the intervention actually varies. Used in. The step \mathbb E[s_tu_{t,h}]=0 in Section 4, which needs s_t to be unrelated to the later interventions inside u_{t,h}, and, together with A3, the step \operatorname{Cov}(s_t,y_{t-1})=0, which leaves \beta_h unchanged when the lagged outcome is dropped. Without it. If interventions are serially correlated, s_t forecasts the later interventions in u_{t,h} and its coefficient absorbs their effects along with its own. Lagged interventions among the controls, as in Ramey and Zubairy’s specification, remove the part of s_t that earlier interventions predict, but they cannot stop s_t from forecasting the interventions that follow it. If \sigma_s^2=0 there is no variation to estimate from. Kind. An identifying restriction.
A3 (Independent disturbances). The disturbances \{v_t\} are independent over time and identically distributed, with mean zero and variance \sigma_v^2, and the whole sequence is independent of \{s_t\}. Meaning. Whatever moves the outcome through v_t neither causes nor is caused by the intervention, at any lead or lag. Used in. The steps \mathbb E[s_tv_{t+j}]=0 and \mathbb E[y_{t-1}u_{t,h}]=0 in Section 4. Without it. A disturbance correlated with s_t is a common cause of the intervention and the outcome, and the regression coefficient moves away from \theta_h; Lecture 3 derives the size of that bias. If the disturbances are serially correlated but still independent of the interventions, \beta_h still equals \theta_h, but \gamma_h no longer equals \rho^{h+1}, because y_{t-1} then also forecasts later disturbances. Kind. Independence from the interventions is an identifying restriction; independence over time is a convenience that keeps the control’s coefficient simple.
A4 (Stationarity). |\rho|<1, and the process has run long enough that y_{t-1} has the same distribution at every date. Meaning. Deviations fade, and the averages that define a population regression are the same whichever date we examine. Used in. Treating the regression coefficients of Section 4 as constants rather than functions of t, and the variance \operatorname{Var}(y_t)=(\theta_0^2\sigma_s^2+\sigma_v^2)/(1-\rho^2) used there. Without it. The response formula Equation 5 survives, but with \rho=1 a response never fades and \operatorname{Var}(y_t) grows with t; Lectures 2 and 5 study how estimates and standard errors behave as \rho approaches one. Kind. A mathematical convenience, and in data an empirical claim about persistence.
The twelve-period economy bends A4 slightly, because it starts from y_0=0 rather than from a draw of the long-run distribution. The larger simulations later in the lecture use a burn-in6 of 100 periods. For the hand calculations the start is harmless, since two paths that share y_0 have a gap that does not depend on it.
3.2 Iterating Forward
We want the gap at t+h caused by s_t. The model gives y_t in terms of y_{t-1}; substituting it into itself repeatedly expresses y_{t+h} in terms of y_{t-1} and everything that arrives from t onward.
The case h=0 is Equation 3 itself. For h=1, write the rule one period later and replace y_t by Equation 3:
\begin{aligned} y_{t+1}&=\rho\,y_t+\theta_0s_{t+1}+v_{t+1}\\ &=\rho\bigl(\rho\,y_{t-1}+\theta_0s_t+v_t\bigr)+\theta_0s_{t+1}+v_{t+1}\\ &=\rho^2y_{t-1}+\rho\,\theta_0s_t+\rho\,v_t+\theta_0s_{t+1}+v_{t+1}. \end{aligned}
One more substitution gives
y_{t+2}=\rho^3y_{t-1}+\rho^2\theta_0s_t+\rho^2v_t+\rho\,\theta_0s_{t+1} +\rho\,v_{t+1}+\theta_0s_{t+2}+v_{t+2}.
The pattern is visible after two steps. Each substitution multiplies everything already present by \rho and appends the new period’s intervention and disturbance with coefficient one. After h+1 steps,
y_{t+h}=\rho^{h+1}y_{t-1}+\sum_{j=0}^{h}\rho^{h-j}\bigl(\theta_0s_{t+j}+v_{t+j}\bigr). \tag{4}
To confirm Equation 4 at every horizon, argue by induction7. It holds at h=0. If it holds at h, then y_{t+h+1}=\rho\,y_{t+h}+\theta_0s_{t+h+1}+v_{t+h+1} multiplies every term of the formula by \rho and appends the j=h+1 term with weight \rho^0=1, which is the formula at h+1.
Equation 4 is an account of where y_{t+h} comes from. The first term is the outcome just before the intervention, discounted by \rho^{h+1} because it has had h+1 periods to fade. The sum collects every intervention and every disturbance dated t through t+h, each discounted by \rho raised to the number of periods it has had to fade. The newest arrivals count fully and the oldest count least.
3.3 The Response Is \theta_0\rho^h
Now run the counterfactual experiment on Equation 4. Remove a one-unit intervention at t, and hold y_{t-1}, every disturbance, and every other intervention fixed. Only the j=0 term of the sum changes, and it changes by \rho^h\theta_0. By the definition Equation 1,
\theta_h=\theta_0\rho^{h}. \tag{5}
The impulse-response function of this economy starts at the impact response \theta_0 and shrinks by the factor \rho each period. Its units are those of \theta_0, units of y per unit of s, at every horizon. Because A1 makes the rule linear, a two-unit intervention has twice this response, and the response does not depend on the date.
Three checks confirm the formula. With \rho=0.5 and \theta_0=1, Equation 5 gives 1, 0.5, 0.25, 0.125, exactly the gaps in Table 1. No disturbance appears in Equation 5, which is why changing the v_t moved the realized path but not the gaps. And the limiting cases do what persistence should: with \rho=0 the response lasts a single period, as \rho approaches one it barely fades, and with \rho<0 it alternates in sign.
Figure 2 isolates the role of persistence. It holds the impact fixed at \theta_0=1 and changes only \rho.
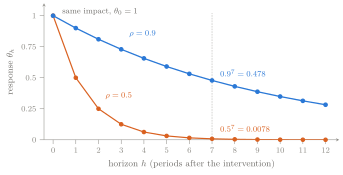
With \rho=0.9 the response first falls below half of its impact value at h=7; with \rho=0.5 it reaches exactly half at h=1 and falls below it at h=2. In this model the intervention contributes only the size of the first step. Everything after that is the outcome’s own dynamics carrying the deviation forward. A central bank’s surprise and a war’s news, if they hit the same outcome with the same impact, would trace the same curve.
That conclusion depends on the single lag. An AR(1) can produce only geometric decay, or an alternating version of it; a response that rises for several periods before it falls, a hump, needs richer dynamics. The military-news response in Section 9 has exactly such a hump. A method that required the researcher to write down the correct dynamics before estimating anything would be fragile for that reason, and the regression derived next does not require it.
The derivation also used two things that data never provide: the rule itself, and the freedom to hold every other term fixed while changing s_t. Data provide rows of (s_t,y_{t-1},y_{t+h}). But Equation 4 already writes y_{t+h} as a coefficient times y_{t-1}, plus a coefficient times s_t, plus everything else.
4 From the Model to a Regression
In the twelve-period economy we found \theta_h by rerunning the rule with one intervention removed. A researcher with data cannot rerun anything. The move available instead is to collect those rows for many dates t and regress the later outcome on the intervention and the earlier outcome. In the economy of Equation 3 that regression recovers \theta_h exactly in population. The work lies in finding which step makes that true.
4.1 Estimands and Population Projections
Three objects need separate names. The estimand is the population quantity a procedure is meant to recover, fixed before any data are drawn; here the causal estimand is \theta_h. A regression targets a population coefficient of its own, defined next, which may or may not equal the estimand. An estimate is a number computed from one sample, and it differs from the coefficient it targets by an amount that changes from sample to sample. The notation keeps population objects and estimates apart: population objects carry no hat, and estimates do.
The population object a regression estimates is a population projection. For an outcome and a set of regressors that includes a constant, it is the linear combination of the regressors with the smallest expected squared prediction error, the best linear predictor8. For the outcome y_{t+h} and the regressors (1,s_t,y_{t-1}) it is written
y_{t+h}=\mu_h+\beta_h s_t+\gamma_h y_{t-1}+u_{t,h}, \qquad \mathbb E[u_{t,h}]=\mathbb E[s_tu_{t,h}]=\mathbb E[y_{t-1}u_{t,h}]=0. \tag{6}
The display has two parts. The first equation splits y_{t+h} into a part explained linearly by the regressors and a residual u_{t,h}. The three conditions after it define the split: the residual has mean zero and is uncorrelated with each regressor. Three conditions pin down three coefficients, provided s_t and y_{t-1} both vary and neither is an exact linear function of the other. The intercept \mu_h, the coefficient \beta_h on the intervention, and the coefficient \gamma_h on the lagged outcome are the numbers that satisfy them. The residual carries two subscripts because it belongs to row t of the horizon-h regression.
The coefficient \beta_h is a projection coefficient, and it is what the regression targets. It is a feature of the joint distribution of y_{t+h}, s_t, and y_{t-1}, and it exists in any economy with finite variances, causal or not. A projection of next year’s GDP on this year’s stock-market return has a coefficient, and nobody would read it as the effect of stock prices on GDP without further argument. Whether \beta_h equals the estimand \theta_h is a separate question, and the answer depends on the economy.
4.2 The Forward Equation Is the Projection
The three conditions also give a way to find the projection: propose values for the coefficients, compute the residual they imply, and check the conditions. If the conditions hold, the proposal is the projection, because only one set of coefficients satisfies them. Equation 4 supplies the proposal. Matching it term by term with Equation 6 suggests \mu_h=0, \beta_h=\theta_0\rho^h, \gamma_h=\rho^{h+1}, and a residual equal to everything else in the forward equation:
u_{t,h}=\sum_{j=0}^{h}\rho^{h-j}v_{t+j}+\theta_0\sum_{j=1}^{h}\rho^{h-j}s_{t+j}. \tag{7}
Sort Equation 7 by date. It contains the disturbances v_t,\dots,v_{t+h} and the interventions s_{t+1},\dots,s_{t+h}. It contains nothing dated t-1 or earlier, and it does not contain s_t, which the proposal has moved into the \beta_h term. At h=0 it is simply v_t.
Now check the conditions one at a time.
- Mean zero. Every term of Equation 7 has mean zero by A2 and A3, so \mathbb E[u_{t,h}]=0.
- Uncorrelated with the intervention. The product s_tu_{t,h} is a sum of terms of the form s_tv_{t+j} with j\ge0 and s_ts_{t+j} with j\ge1. Terms of the first kind have expectation zero because the interventions are independent of the disturbances (A3); terms of the second kind because interventions are independent over time with mean zero (A2). So \mathbb E[s_tu_{t,h}]=0.
- Uncorrelated with the lagged outcome. Iterating Equation 3 backward writes y_{t-1} as a discounted sum of interventions and disturbances dated t-1 and earlier, a sum that settles down because |\rho|<1 (A4). Every term of u_{t,h} is dated t or later, and by A2 and A3 each such term is independent of everything dated t-1 or earlier. So \mathbb E[y_{t-1}u_{t,h}]=0.
All three conditions hold, so the proposal is the projection:
y_{t+h}=\mu_h+\beta_h s_t+\gamma_h y_{t-1}+u_{t,h},\qquad \beta_h=\theta_h=\theta_0\rho^{h},\quad \gamma_h=\rho^{h+1},\quad \mu_h=0. \tag{8}
Equation 8 answers the lecture’s guiding question in its simplest setting. The population regression of the outcome h periods ahead on a constant, today’s intervention, and yesterday’s outcome has a coefficient on the intervention equal to the causal response at horizon h: under A1–A4, the coefficient the regression targets and the estimand coincide. Running that regression separately for each h=0,1,\dots,H and collecting the coefficients traces out the impulse-response function, one point per regression. Exercise 2 carries out the substitution for h=1 and h=2 and then in general.
A regression estimated horizon by horizon in this way is a local projection. In general form, with a vector \mathbf w_t of predetermined controls containing p lags,
y_{t+h}=\mu_h+\beta_h s_t+\boldsymbol\gamma_h'\mathbf w_t+u_{t,h},\qquad h=0,1,\dots,H, \tag{9}
and the estimated response is the sequence \hat\beta_0,\dots,\hat\beta_H (Jordà, 2005; Jordà and Taylor, 2025). In this lecture \mathbf w_t=y_{t-1} and p=1. The word local9 refers to estimating each horizon on its own rather than iterating one model forward.
4.3 What Made the Coefficient Causal
The hand counterfactual changed s_t while holding every other term fixed. A regression cannot hold anything fixed. It compares outcomes across dates with different interventions, and it succeeds here because of what u_{t,h} contains. Across the many dates of a long sample, the disturbances and later interventions inside u_{t,h} are unrelated to s_t. Dates with large and small interventions therefore differ, on average, only through s_t itself; the regression also adjusts for differences in y_{t-1} that arise by chance. The counterfactual is reconstructed from other dates rather than rerun.
That argument locates the causal content exactly. Steps 2 and 3 of the check used A2 and A3; nothing about regression did. Least squares would have returned a projection coefficient in any economy. If the intervention were correlated with a disturbance inside u_{t,h}, the same regression on the same kind of data would converge to a number other than \theta_h, and nothing in its output would announce the difference. Calling s_t an intervention variable rather than a shock keeps that possibility in view until Lecture 3 can address it.
The other two coefficients carry no causal reading. \gamma_h=\rho^{h+1} is the fading echo of the pre-intervention outcome, not a response to anything. \mu_h=0 only because the interventions and disturbances have mean zero. With the binary intervention of the twelve-period economy, whose mean is 0.3, the intercept absorbs that mean and neither \beta_h nor \gamma_h changes. The course reports intercepts and control coefficients but does not interpret them.
A long simulated sample confirms the algebra. With \rho=0.9, \theta_0=\sigma_s=\sigma_v=1, and T=100{,}000 periods (seed 4), the regression gives \hat\beta_h=0.9985, 0.9013, 0.8117, 0.6498, and 0.4249 at h=0,1,2,4,8, against \theta_h=1, 0.9, 0.81, 0.6561, and 0.4305. The control coefficients are \hat\gamma_h=0.8990, 0.8068, 0.7235, 0.5825, and 0.3792, against \rho^{h+1}=0.9, 0.81, 0.729, 0.5905, and 0.3874. Every estimate lies within 0.01 of its population value.
4.4 Why Include the Lagged Outcome?
Condition 2 of the check never mentioned y_{t-1}. What happens, then, if the control is dropped and y_{t+h} is regressed on a constant and s_t alone?
Nothing happens to the coefficient the regression targets. The omitted term \rho^{h+1}y_{t-1} moves into the residual, but s_t is uncorrelated with it, because y_{t-1} depends only on earlier dates. A regressor that is uncorrelated with an omitted term keeps its population coefficient, so the projection of y_{t+h} on (1,s_t) still has coefficient \theta_h on s_t.
The residual, however, grows. Its variance gains \rho^{2(h+1)}\operatorname{Var}(y_{t-1}). Under A4 the variance of y is the same at every date, so taking variances of both sides of Equation 3 gives \operatorname{Var}(y)=\rho^2\operatorname{Var}(y)+\theta_0^2\sigma_s^2+\sigma_v^2, or \operatorname{Var}(y)=(\theta_0^2\sigma_s^2+\sigma_v^2)/(1-\rho^2). With \rho=0.9 and unit variances, \operatorname{Var}(y)=2/0.19=10.53, and at h=0 the residual variance rises from \sigma_v^2=1 to 1+0.81\times10.53=9.53. At h=0, s_t is independent of every term in either residual and neither residual contains a later intervention, so the standard deviation of \hat\beta_0 in large samples is approximately the residual standard deviation divided by \sigma_s\sqrt{T_0}. The regression with the control has 199 rows, and the one without it can also use the first period, which gives 1/\sqrt{199}=0.071 with the control and \sqrt{9.53}/\sqrt{200}=0.218 without it.
A Monte Carlo experiment checks the approximation in samples of realistic size. Draw R=500 samples from Equation 3, each of 300 periods with the first 100 discarded, so T=200 (seed 3). In each sample run both regressions at every horizon, then summarize the 500 estimates. Table 2 reports their means and standard deviations.
| \rho | h | \theta_h | Mean, with y_{t-1} | SD, with y_{t-1} | Mean, without | SD, without |
|---|---|---|---|---|---|---|
| 0.5 | 0 | 1.0000 | 1.0039 | 0.0730 | 1.0027 | 0.0946 |
| 0.5 | 4 | 0.0625 | 0.0523 | 0.1235 | 0.0552 | 0.1236 |
| 0.5 | 8 | 0.0039 | −0.0034 | 0.1234 | −0.0035 | 0.1229 |
| 0.9 | 0 | 1.0000 | 1.0040 | 0.0734 | 0.9666 | 0.2177 |
| 0.9 | 4 | 0.6561 | 0.6298 | 0.1978 | 0.6201 | 0.2693 |
| 0.9 | 8 | 0.4305 | 0.3973 | 0.2284 | 0.3979 | 0.2664 |
At \rho=0.9 and h=0 the control cuts the standard deviation from 0.2177 to 0.0734, a factor of three, close to the large-sample values 0.218 and 0.071. The gain shrinks as h grows, because the omitted term \rho^{h+1}y_{t-1} fades. At \rho=0.5 it has essentially vanished after impact: at h=4 the added variance \rho^{10}\operatorname{Var}(y) is 0.003. The means sit near \theta_h but not exactly on it, and at \rho=0.9 the gaps are larger than simulation noise. The regression without the control averages 0.9666 at h=0, and the one with it falls short by 0.026 at h=4 and 0.033 at h=8. These are small-sample biases, properties of estimates from 200 periods rather than of the population coefficient, and Lecture 2 takes them up.
The control can be dropped without changing \beta_h only because A2 and A3 make s_t unrelated to y_{t-1}. An intervention that responds to past outcomes, such as a policy rate set with an eye on recent output, breaks that link: dropping y_{t-1} then changes what the coefficient measures, and the control becomes part of the identification argument. In this lecture y_{t-1} is there for precision; in most of the course controls do both jobs.
Table 3 collects the notation introduced so far. Each symbol returns below where it does its work.
| Symbol | Meaning | Timing | Units |
|---|---|---|---|
| t, T | Calendar date of an observation and of a regression row; length of the series | — | periods |
| h, H | Horizon; largest horizon estimated | outcome dated t+h | periods |
| y_t, s_t | Outcome; intervention variable | t | units of y; units of s |
| y^{c}_t | Counterfactual path with one intervention removed | dates of y_t | units of y |
| \theta_h, \theta_0 | Causal response at horizon h, the estimand; impact response | t+h; t | units of y per unit of s |
| \rho | Persistence of the AR(1) outcome | — | none |
| v_t | Outcome disturbance | t | units of y |
| \sigma_s, \sigma_v | Standard deviations of s_t and v_t | — | units of s; units of y |
| \beta_h, \hat\beta_h | Projection coefficient on s_t, the regression’s target; its least-squares estimate | row t, outcome t+h | units of y per unit of s |
| \mu_h, \gamma_h | Intercept; coefficient on the control y_{t-1} | — | units of y; none here |
| \mathbf w_t, p | Predetermined controls; number of lags they contain | dated t-1 or earlier | units of each control; lags |
| u_{t,h} | Horizon-h residual in row t | disturbances t,\dots,t+h; interventions t+1,\dots,t+h | units of y |
| \mathcal T_h, T_h | Estimation sample at horizon h and its size | — | rows |
| R | Number of Monte Carlo replications | — | count |
The population regression is settled. A sample, though, contains a finite number of dates, and the estimate depends on which of those dates had interventions and how far each intervention was from the average.
5 Why Many Shock Dates
The argument of the previous section averaged over “the many dates of a long sample.” The opening situation had, in effect, one. To see what a finite sample can and cannot deliver, we look inside the least-squares slope and ask how it uses each row.
5.1 How a Slope Uses Its Rows
Take the simplest version first: the regression of y_{t+h} on a constant and s_t alone, over whatever rows are available at horizon h. Write \bar s and \bar y for the means of s_t and y_{t+h} over those rows. The familiar slope is \sum_t(s_t-\bar s)(y_{t+h}-\bar y)/\sum_t(s_t-\bar s)^2. Because the deviations s_t-\bar s sum to zero, the \bar y term contributes nothing, and the slope can be written as a weighted sum of outcomes:
\hat\beta_h=\frac{\sum_t(s_t-\bar s)\,y_{t+h}}{\sum_t(s_t-\bar s)^2} =\sum_t\omega_t\,y_{t+h}, \qquad \omega_t=\frac{s_t-\bar s}{\sum_\tau(s_\tau-\bar s)^2}. \tag{10}
Read Equation 10 as a vote. Each row contributes its outcome, weighted by how far its intervention was from the average. A row with an average intervention has no say. Rows with unusually large interventions pull the slope toward their outcomes, and rows with small ones pull it the other way. The weights10 sum to zero and satisfy \sum_t\omega_ts_t=1, which are the two properties that make the slope ignore any constant added to the outcomes and recover the slope exactly when every outcome lies on a line in s_t.
Together, the two properties isolate the estimation error. Write the outcome as y_{t+h}=\tilde\mu_h+\beta_hs_t+\tilde u_{t,h}, where \tilde u_{t,h} is everything in y_{t+h} that the intervention does not explain; without the control, it holds both u_{t,h} and \rho^{h+1}y_{t-1}. Substituting into Equation 10 and using the two properties,
\hat\beta_h=\beta_h+\sum_t\omega_t\,\tilde u_{t,h}. \tag{11}
The estimate equals the population coefficient plus a weighted sum of everything else that happened in the rows. When many rows carry interventions of different sizes, and A2 and A3 make those interventions unrelated to everything else, the weighted sum averages toward zero. When few rows carry interventions, it need not.
The denominator of Equation 10 also says where the information comes from. Row t supplies the share (s_t-\bar s)^2/\sum_\tau(s_\tau-\bar s)^2 of the variation the slope is estimated from. A sample in which a handful of dates had very large interventions and every other date had none is, for the purposes of this slope, a sample of a handful of dates. Section 9 measures those shares in the military-news data.
5.2 One Episode
Now push the argument to the opening’s situation. Suppose exactly one row \tau has an intervention, s_\tau=1, and the other n-1 rows have s_t=0. Then \bar s=1/n and \sum_t(s_t-\bar s)^2=(1-1/n)^2+(n-1)/n^2=(n-1)/n. The weight on row \tau is (1-1/n)\big/\bigl((n-1)/n\bigr)=1, and the weight on each other row is -(1/n)\big/\bigl((n-1)/n\bigr)=-1/(n-1). The slope is therefore
\hat\beta_h=y_{\tau+h}-\frac{1}{n-1}\sum_{t\neq\tau}y_{t+h} =y_{\tau+h}-\bar y_{\text{others}}. \tag{12}
Taken literally, Equation 12 is the episode’s outcome h periods later minus the average outcome h periods after every other date. Substitute the forward equation for the episode’s outcome. With \theta_0=1 and s_\tau=1, Equation 4 gives y_{\tau+h}=\theta_h+\rho^{h+1}y_{\tau-1}+u_{\tau,h}, so
\hat\beta_h=\theta_h+\Bigl(\rho^{h+1}y_{\tau-1}+u_{\tau,h}-\bar y_{\text{others}}\Bigr).
The estimate is the response plus everything else that shaped that one episode, measured against the other dates. The data contain one number, not two, and nothing in them separates the response from the bracket.
The twelve-period economy puts numbers in the bracket. Keep only the intervention at t=5: regress the realized outcomes on an indicator that equals one at t=5 and zero elsewhere, over rows t=2,\dots,12 at h=0. The ten other outcomes sum to 9.636474609375, so their mean is 0.9636474609375, and
\hat\beta_0=y_5-\bar y_{\text{others}}=-0.66875-0.9636474609375=-1.6323974609375.
Since y_5=0.5\,y_4+\theta_0+v_5=0.03125+1-1.7, the estimate splits into \theta_0=1 and everything else: -1.6323974609375=1+(0.03125-1.7-0.9636474609375). The disturbance of -1.7 in the episode itself outweighs the response. The same calculation at h=1 and h=2 gives -0.984608 and 1.512823, against true responses of 0.5 and 0.25: the wrong sign twice and six times too large once. Exercise 5 proves Equation 12 and repeats these numbers.
The Korean episode has the same structure, with taxes, the Accord, and price controls inside its bracket. More episodes help only by averaging, and averaging helps only if the other things are unrelated to the interventions across episodes. If every quarter of war news also brought tax increases, adding wars would not separate spending news from taxes, because the weighted sum in Equation 11 would settle on something other than zero. That is the identification question again, and it belongs to Lecture 3. What this section establishes is narrower: a local projection is an average over every date with variation in s_t, never a reading of one episode, and its precision depends on how many dates carry that variation.
The formulas so far have treated “the rows” as given. Which rows enter a horizon-h regression is itself a calculation, and it is worth doing once by hand.
6 Building the Rows by Hand
A local projection needs the outcome h periods after each date and, in this lecture, the outcome one period before. Near the end of a sample the first does not exist; at the start the second does not. The twelve-period economy is small enough to list its rows for h=0,1,2 and compute every slope by hand, and those slopes show why twelve periods cannot deliver the answer that Equation 8 promises.
6.1 Leads, Lags, and Regression Rows
A lead of a series is its value k periods later, y_{t+k}, and a lag is its value k periods earlier, y_{t-k}. In a sample of T periods the lead y_{t+k} is missing in the last k rows and the lag y_{t-k} in the first k. In Stata the time-series operators11 F. and L. construct them.
A regression row of the horizon-h regression is one dated observation: the intervention s_t and the control y_{t-1} at date t, paired with the outcome y_{t+h}. The row is dated by the intervention, not by the outcome. Row 5 of the h=2 regression holds s_5, y_4, and y_7.
The estimation sample \mathcal T_h is the set of rows in which every variable of the horizon-h regression is nonmissing, and T_h is its size. Row t needs the lag y_{t-p}, which exists only for t\ge p+1, and the lead y_{t+h}, which exists only for t\le T-h. Counting the rows between those limits gives
T_h=T-h-p . \tag{13}
Each additional horizon costs one row at the end of the sample, and each lag costs one row at the start. In the twelve-period economy T=12 and p=1, so T_0=11, T_1=10, and T_2=9, using rows t=2,\dots,12, then 2,\dots,11, then 2,\dots,10. The count holds only when leads and lags are the only source of missing values; Section 9 meets a case where the data begin earlier for one variable than another. The regression without the control could also use row 1, but we keep t\ge2 throughout so that the two regressions use the same rows and differ only in the control.
Figure 3 shows the three samples.
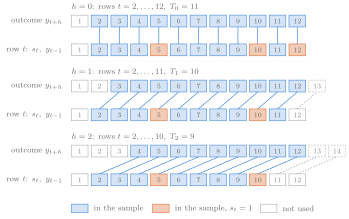
The staircase also exposes a detail that the population algebra handled quietly. At h=1, row 4 has s_4=0, so it sits in the comparison group, yet its outcome is y_5, which contains the intervention s_5. That is the term \theta_0s_{t+1} inside u_{t,1} in Equation 7. In population it does no harm, because s_5 is unrelated to s_4; in a sample of ten rows it is one more source of noise in the comparison.
In Stata the three regressions are a three-line loop over the hand table:
import delimited using hand_table.csv, clear asdouble   // variables t s v y
tsset t
forvalues h = 0/2 {
    regress F`h'.y s if t >= 2
}
6.2 The Slope as a Difference in Means
With a binary intervention, Equation 10 simplifies to arithmetic that can be done by hand. Suppose n_1 of the n rows have s_t=1 and the other n_0=n-n_1 have s_t=0, and write \bar y_1 and \bar y_0 for the mean of y_{t+h} in the two groups. Then \bar s=n_1/n, and the denominator of the slope is
\sum_t(s_t-\bar s)^2=n_1\Bigl(1-\frac{n_1}{n}\Bigr)^2+n_0\Bigl(\frac{n_1}{n}\Bigr)^2 =\frac{n_1n_0}{n}.
For the numerator, split the sum into the two groups:
\sum_t(s_t-\bar s)\,y_{t+h} =n_1\bar y_1-\frac{n_1}{n}\bigl(n_1\bar y_1+n_0\bar y_0\bigr) =\frac{n_1n_0}{n}\bigl(\bar y_1-\bar y_0\bigr).
Dividing the second display by the first,
\hat\beta_h=\bar y_1-\bar y_0 . \tag{14}
The slope is the mean outcome h periods after intervention rows minus the mean outcome h periods after the other rows, and the intercept is \bar y_0. Equation 12 is the special case n_1=1.
In the hand table, Equation 14 needs only group sums. At h=0 the rows are t=2,\dots,12 and the intervention rows are 5, 10, and 12. Their outcomes sum to y_5+y_{10}+y_{12}=3.792626953125, so \bar y_1=1.264208984375. The eight other outcomes sum to 5.17509765625, so \bar y_0=0.64688720703125, and \hat\beta_0=0.61732177734375. At h=1 the last row is 11, so row 12 and its intervention have left the sample. The intervention rows are 5 and 10, whose outcomes are y_6 and y_{11}: \bar y_1=-0.06982421875/2=-0.034912109375, \bar y_0=7.587548828125/8=0.948443603515625, and \hat\beta_1=-0.983355712890625. At h=2 the rows end at 10, the intervention rows are again 5 and 10 with outcomes y_7 and y_{12}: \bar y_1=4.565087890625/2=2.2825439453125, \bar y_0=1.62763671875/7=0.23251953125, and \hat\beta_2=2.0500244140625. Table 4 collects the results.
| h | T_h | Rows | Intervention rows | \bar y_1 | \bar y_0 | \hat\beta_h, no control | \hat\beta_h, with y_{t-1} | \theta_h |
|---|---|---|---|---|---|---|---|---|
| 0 | 11 | 2–12 | 5, 10, 12 | 1.264209 | 0.646887 | 0.617322 | 0.575667 | 1 |
| 1 | 10 | 2–11 | 5, 10 | −0.034912 | 0.948444 | −0.983356 | −1.050405 | 0.5 |
| 2 | 9 | 2–10 | 5, 10 | 2.282544 | 0.232520 | 2.050024 | 2.153022 | 0.25 |
Stata’s regress returns 0.61732179, -0.98335569, and 2.05002437. The differences in the eighth decimal come from floating-point storage12, not from the arithmetic. Adding y_{t-1} changes the slopes to 0.575667, -1.050405, and 2.153022, on the same rows. Exercise 3 builds these rows by hand, and Exercise 4 reproduces them in Stata with assertions.
None of the six estimates is close to its target. The impact estimate is 0.62 against 1, the h=1 estimate has the wrong sign, and the h=2 estimate is eight times too large. Equation 11 explains why. With two or three intervention rows, the weighted sum of everything else is dominated by a few disturbances: the h=1 intervention rows have outcomes y_6 and y_{11}, and y_6 carries half of y_5, with its disturbance of -1.7, while y_{11} receives v_{11}=-0.9. The arithmetic of a local projection is the same in a sample of twelve periods as in a sample of two hundred. What changes is how many rows vote and how much of the noise their votes cancel.
7 Reading the Response Graph
The hand table produced three numbers. A response is usually read as a curve, and a curve raises two new problems. It needs one regression per horizon, organized so that every coefficient stays attached to the rows behind it. And it needs labels, because a curve by itself does not say what a unit of the intervention is, what the vertical axis measures, or what the comparison is.
7.1 From One Regression per Horizon to a Curve
Take one simulated sample from Equation 3 with \rho=0.9 and \theta_0=\sigma_s=\sigma_v=1: 300 periods drawn with seed 2, the intervention drawn before the disturbance, and the first 100 periods discarded, so T=200. The same 200 observations are shipped with the browser lab and the practicum, so every medium works with identical rows. A loop estimates the response for h=0,\dots,12 and stores each coefficient with its sample size:
import delimited using onedraw_rho09_seed2.csv, clear   // variables t s v y
tsset t
tempname P
postfile `P' h double beta_h T_h using results_onedraw, replace
forvalues h = 0/12 {
    quietly regress F`h'.y s L.y
    post `P' (`h') (_b[s]) (e(N))
}
postclose `P'
use results_onedraw, clear
assert T_h == 199 - h
Storing e(N) in the same post as _b[s] is what keeps each coefficient and its row count together. The assertion checks Equation 13 with T=200 and p=1; if a missing value had crept into the data, the loop would still run, and only the assertion would notice. Exercise 6 runs this loop and draws the graph, and Exercise 7 wraps it in a Monte Carlo experiment.
7.2 What a Response Graph Must Say
A response graph plots \hat\beta_h against h. Four pieces of information are needed to read it, and the curve supplies none of them.
- The intervention and its units. A coefficient is a response per unit of s, so the reader must know what one unit is. Here it is one unit of the simulated intervention, which is also one standard deviation because \sigma_s=1.
- The outcome’s units. The vertical axis is in units of y; in data it might be percent, percentage points, or points of trend GDP, and Lecture 2 shows how easily those are confused.
- The horizon unit. The horizontal axis counts periods after the intervention, with h=0 the period of the intervention itself.
- The counterfactual. The vertical axis measures the gap from the path without the intervention. A value of zero means “no different from that path,” not “the outcome is zero” and not “the outcome is back where it started.”
The intercept \mu_h is not on the graph and is not the counterfactual path. It absorbs means and says nothing about what would have happened without the intervention. A complete caption fills the four slots and leaves the intercept out; Figure 4 is captioned that way.
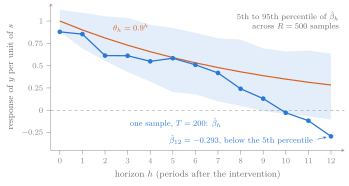
The sample gives \hat\beta_0=0.878940, \hat\beta_4=0.548477, \hat\beta_8=0.240595, and \hat\beta_{12}=-0.293297, against \theta_h=1, 0.6561, 0.4305, and 0.2824. Every one of the thirteen estimates is below its target, and from h=8 on the shortfall grows steadily, from 0.19 to 0.58. Read on its own, the curve says that the response turns negative after ten periods. The true response is positive at every horizon.
The 5–95 percent band13 shows how unusual this sample is. Across 500 simulated samples, 90 percent of the estimates at h=8 lie between 0.047 and 0.793, so a sample of 200 periods can deliver almost any value in that range. This sample sits just below the band’s lower edge at h=0, stays inside it from h=1 through h=10, and falls below it at h=11 and h=12. The seed was fixed before any estimate was computed, and the draw is kept because its failure is informative: the errors at neighbouring horizons are not independent. Adjacent regressions use almost the same rows, and Section 8 shows that their residuals share most of their terms. When one horizon’s estimate is too low, its neighbours tend to be too low as well.
The same 500 samples also show where the estimates are centred. With \rho=0.5, the mean estimate is within 0.014 of \theta_h at every horizon. With \rho=0.9 it falls systematically short: by 0.026 at h=4, 0.033 at h=8, and 0.049 at h=12. The Monte Carlo standard error14 of those means is about 0.01, so the gap at h=12 is almost five times its standard error. It is the small-sample bias already visible in Table 2, and Lecture 2 explains it.
The graph still lacks what a published response graph normally shows: a band computed from the sample itself. The band in Figure 4 used knowledge of the true economy that no researcher has. A band built from one sample has to start from the residual, and the residual has a structure of its own.
8 What the Residual Contains
The estimates in Figure 4 erred in the same direction at every horizon. The source of that pattern is visible in Equation 7 once the residuals of two rows are written side by side.
8.3 What This Does and Does Not Imply
Serially correlated residuals usually prompt a worry about standard errors, and the worry is not wrong. But Equation 11 shows that what enters the estimate is the residual multiplied by the intervention, not the residual alone. Consider the products s_tu_{t,h} and s_{t+k}u_{t+k,h} for k\ge1. The intervention s_t appears in neither residual and not in s_{t+k}, it is independent of all of them, and it has mean zero, so the expected product of the two terms is zero. The products are uncorrelated even though the residuals are not. Lecture 5 shows that inference on \beta_h depends on the autocorrelation of s_tu_{t,h}, which in this economy is zero because s_t is independent of everything else in both products and the control y_{t-1} keeps earlier interventions out of the residual, and it examines what changes when either fails (Montiel Olea and Plagborg-Møller, 2021).
This lecture records the structure and stops there. The toy economy has done its work. Beyond this point no known response is available to check an estimate against, and the regression meets the data the lecture began with.
9 First Contact with Data
The opening asked what military news did to output. We now run the local projection Equation 9 on the quarterly data behind that question, with \mathbf w_t=y_{t-1} exactly as in the simulations: least squares of y_{t+h} on a constant, s_t, and y_{t-1}, one regression for each h=0,\dots,20.
9.1 The Data and Their Units
The data are Ramey and Zubairy’s quarterly U.S. series for 1889Q1–2015Q4, 508 quarters, from the rzdat sheet of RZDAT.xlsx in their February 2018 replication package (Ramey and Zubairy, 2018). The workbook’s readme sheet is dated November 21, 2016, and the package’s jordagk.do describes the file as updated April 7, 2016. The course does not redistribute the file: Practicum 01 downloads it from the authors’ archive and verifies its checksum, and the browser lab displays only estimates computed from it.
The outcome is real GDP divided by trend GDP, y_t=\texttt{rgdp}_t/\texttt{rgdp\_pott6}_t. Both series are in billions of chained 2009 dollars16 at an annual rate, so y_t has no units and averages 0.987 over the sample. A change of 0.01 in y_t is a change in GDP of one percent of trend GDP.
The intervention variable is the military news,
s_t=\frac{\texttt{news}_t}{\texttt{rgdp\_pott6}_{t-1}\times\texttt{pgdp}_{t-1}},
the change in the expected present value of military spending announced in quarter t, in billions of nominal dollars, divided by the previous quarter’s nominal trend GDP at an annual rate. Military news17 is recorded by the quarter in which it arrived, which is why it is dated t and the control y_{t-1} one quarter earlier. The series is nonmissing from 1890Q1 to 2015Q4, 504 quarters, and nonzero in only 108 of them. Its mean is 0.007222 and its standard deviation 0.059728. The two largest values are 0.691893 in 1941Q4 and 0.600073 in 1950Q3. A unit of s_t is news worth a full year of trend GDP, so coefficients are best read per 0.01: news worth one percent of trend GDP.
Counting rows needs one adjustment to Equation 13. Row t needs s_t, which starts in 1890Q1, and y_{t-1}, which exists there because GDP starts four quarters earlier. The lag therefore costs no row, and the horizon-h regression has T_h=504-h rows, from 1890Q1 to h quarters before 2015Q4. The formula counts a lag as a lost row only when the lagged variable begins where the sample does.
9.2 A Hump
The estimates rise from \hat\beta_0=0.080313 at impact to \hat\beta_4=0.259141 and \hat\beta_8=0.361906, peak at \hat\beta_{10}=0.404210, and fall back to 0.0796 by h=20. Figure 5 plots them.
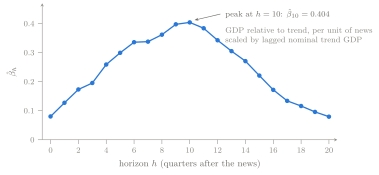
In words: news worth one percent of trend GDP is followed ten quarters later by GDP about 0.40 percent of trend GDP above what the regression otherwise predicts from the previous quarter’s output. The shape is a hump, which Section 3 showed an AR(1) cannot produce, and the local projection found it without being told what shape to expect.
Changing the controls changes the numbers. With Ramey and Zubairy’s own set, so that \mathbf w_t in Equation 9 holds four lags each of the news, of y, and of government spending relative to trend (p=4), the sample becomes T_h=500-h and the coefficients are 0.0510 at h=0, 0.2938 at h=10, and 0.0671 at h=20. These equal, to the digits shown, the linear GDP response in Ramey and Zubairy’s replication code, which Lecture 4 reproduces. The peak falls by about a quarter. Which of the two specifications deserves a causal reading, if either, is not a question the regression can answer.
9.3 Where the Variation Comes From
Equation 10 says that each quarter supplies the share (s_t-\bar s)^2/\sum_\tau(s_\tau-\bar s)^2 of the variation behind the slope. Table 6 lists the six largest shares in the h=8 sample of 496 quarters.
| Quarter | News, fraction of trend GDP | Share of variation | Cumulative share |
|---|---|---|---|
| 1941Q4 | 0.6919 | 0.2612 | 0.2612 |
| 1950Q3 | 0.6001 | 0.1958 | 0.4570 |
| 1942Q3 | 0.4328 | 0.1009 | 0.5579 |
| 1950Q4 | 0.4022 | 0.0869 | 0.6448 |
| 1917Q2 | 0.3729 | 0.0745 | 0.7193 |
| 1941Q2 | 0.3401 | 0.0617 | 0.7811 |
The quarter of Pearl Harbor and the first full quarter of the Korean War supply 45.7 percent of the variation in s_t between them; four quarters supply 64.5 percent and six supply 78.1 percent. Of 496 rows, a handful carry the estimate. The data are closer to the one-episode case of Equation 12 than their length suggests.
A direct test confirms it. At h=8 the estimate is 0.3619 on the full sample. Dropping the single row for 1950Q3 raises it to 0.4340, so one quarter out of 496 moves the coefficient by 0.072. Dropping 1941Q4 instead gives 0.3443, and dropping both gives 0.4451. Using only rows from 1947Q1 on, 268 of them, gives 0.0587. Removing Korea’s news quarter raises the estimate: measured against the regression’s average, what followed the Korean news was smaller than what followed the other large episodes. And most of what the full-sample coefficient reports comes from before 1947. Exercise 9 reproduces the response, the shares, and the drop-one estimate from the data.
9.4 What Has Not Yet Been Argued
Figure 5 is a response graph, and its caption names the intervention, the units, and the counterfactual. It is not yet evidence about what military news does to output. At least five claims stand between the estimate and that conclusion, and each belongs to a later lecture.
- Units and transformation. The outcome is a level relative to a trend fitted with data through 2015, and the coefficient is per unit of scaled news. Whether the level, the change, or the accumulated response answers the policymaker’s question, and what units each carries, is Lecture 2.
- Controls. One lag of y was a choice. Ramey and Zubairy’s controls lower the peak by a quarter, and which controls belong depends on what drives the news, which is Lecture 3.
- Identification. The argument that equated the coefficient with \theta_h required the news to be an observed shock in the sense of A2 and A3: unpredictable from the past and unrelated to the taxes, monetary policy, price controls, and war that arrived with it. Lecture 3 argues about that, and Lecture 4 uses the news to estimate the effect of spending itself.
- Uncertainty. No standard error or band has been computed. Overlapping windows make the residuals serially correlated, and Lectures 5 and 6 build intervals that respect what Section 8 found.
- Episode dependence. Two quarters carry 46 percent of the variation, and dropping one moves the h=8 estimate by 0.07. Lecture 13 turns this into a systematic sensitivity analysis.
A sixth claim is hidden in A1. The regression treats news worth 69 percent of trend GDP as having 69 times the effect of news worth one percent, in slack and in booming economies alike; Lectures 9 and 10 ask what a linear coefficient means when that fails.
10 Handoff
The policymaker of June 1950 wanted to know what the buildup would do to output. The lecture cannot answer that question yet, but it can now say precisely what a local projection offers in reply. Each coefficient compares what followed quarters with more news against what followed quarters with less, holding the previous quarter’s output fixed. In an economy where the news is an observed shock, that comparison equals the gap between the realized path and the path without the news. The coefficients are estimated one horizon at a time from rows that shrink as the horizon grows. Their variation comes from every quarter with news, weighted by how unusual the news was, and in these data a few war quarters dominate.
The opening’s evidence can now be set beside the regression. The realized rise in output from 1950Q2 to 1953Q1 was 0.0787 of trend GDP. Scaling the h=10 coefficient by Korea’s news gives 0.600073\times0.404210=0.2426, three times larger. Neither number is the effect of Korea’s news. The first is a change along one realized path, which Equation 2 splits into a response and everything else. The second applies an average over many episodes, led by 1941Q4, to one of them, with controls and identification unargued. Exercise 10 asks you to take the comparison apart.
We can now produce a defined estimand, a derivation showing when a regression recovers it, the rows of that regression listed by hand, a loop that estimates the curve, and a response graph whose caption says what it measures. We cannot yet defend a choice of the outcome’s form. Every regression in this lecture used the level y_{t+h}. The opening’s 7.87 points was a change, y_{t+h}-y_{t-1}, and Section 1 insisted that a change since the date before is not a causal response. Yet y_{t-1} also sits on the right-hand side of the regression behind every response graph we drew. If we regress y_{t+h}-y_{t-1} instead of y_{t+h}, is the answer different, or the same answer in different clothes? Lecture 2 begins there.
Exercises
Exercises marked [core] prepare material used later in the course.
Exercise 1: Two paths, one difference
Problem. [core, pencil] The twelve-period economy of the notes follows y_t=0.5\,y_{t-1}+s_t+v_t with y_0=0, and its interventions fall at t=1,5,10,12. Around the second intervention the realized path is y_4=0.0625, y_5=-0.66875, y_6=-0.134375, y_7=2.0328125, and y_8=-0.28359375, and the disturbances are v_5=-1.7, v_6=0.2, v_7=2.1, and v_8=-1.3.
Build the counterfactual path y^{c}_t for t=5,\dots,8 by switching off the intervention at t=5 and nothing else. Tabulate y_t, y^{c}_t, the gap y_t-y^{c}_t, and the change since the date before, y_t-y_4.
Split each change y_t-y_4 into the causal response and the change the economy would have made without the intervention. At which dates does reading the change as the effect get the sign wrong, and by what factor does it overstate the effect at t=7?
Without repeating the recursion, give the four gaps that would result if every v_t were replaced by zero, and explain why.
Exercise 2: Iterate forward
Problem. [core, pencil] Let y_t=\rho\,y_{t-1}+\theta_0s_t+v_t, where the interventions s_t and the disturbances v_t each have mean zero, are independent over time, and are independent of each other, and |\rho|<1 (Assumptions A1–A4 of the notes).
Substitute the rule into itself to write y_{t+1} and then y_{t+2} in terms of y_{t-1} and the interventions and disturbances dated t onward. State the general formula for y_{t+h} and prove it by induction.
Change s_t by one unit while holding y_{t-1}, every disturbance, and every other intervention fixed. Derive the causal response \theta_h.
For the population regression of y_{t+h} on (1,s_t,y_{t-1}), read off \mu_h, \beta_h, \gamma_h, and the residual u_{t,h} from your formula. Show that \mathbb E[u_{t,h}]=\mathbb E[s_tu_{t,h}]=\mathbb E[y_{t-1}u_{t,h}]=0, and name the assumption each step uses.
With \theta_0=1 and \rho=0.9, compute \theta_4 and \theta_7, and find the first horizon at which the response is below half of its impact value.
Exercise 3: Rows by hand
Problem. [core, pencil] In the twelve-period economy the interventions are s_t=1 at t=1,5,10,12 and s_t=0 otherwise, and the realized outcomes are
| t | y_t | t | y_t | t | y_t |
|---|---|---|---|---|---|
| 1 | 1.9 | 5 | −0.66875 | 9 | 0.658203125 |
| 2 | 1.45 | 6 | −0.134375 | 10 | 1.9291015625 |
| 3 | 1.325 | 7 | 2.0328125 | 11 | 0.06455078125 |
| 4 | 0.0625 | 8 | −0.28359375 | 12 | 2.532275390625 |
For h=0,1,2, consider the regression of y_{t+h} on a constant and s_t, using only rows with t\ge2 so that y_{t-1} would exist in every row.
List the rows of each regression and give T_h. Check your count against T_h=T-h-p.
Identify the intervention rows and compute the mean of y_{t+h} over the intervention rows, \bar y_1, and over the other rows, \bar y_0.
Compute \hat\beta_h and compare it with \theta_h=0.5^h.
Row 4 of the h=1 regression sits in the comparison group. What is its outcome, and why is that outcome not a clean comparison?
Exercise 4: The same rows in Stata
Problem. [core, computational] Reproduce the regressions of Exercise 3 in Stata, then add the lagged outcome as a control on the same rows. Write a do-file that
enters the twelve rows of the hand table (the values of s_t and v_t are s_t=1 at t=1,5,10,12 and v_t=0.9,\,0.5,\,0.6,\,-0.6,\,-1.7,\,0.2,\,2.1,\,-1.3,\,0.8,\,0.6,\,-0.9,\,1.5), rebuilds y_t from y_t=0.5\,y_{t-1}+s_t+v_t with y_0=0, and declares the data with
tsset t;loops over h=0,1,2 with
forvalues, computes \bar y_1 and \bar y_0 withsummarize, and runsregress F`h'.y s if t >= 2with and withoutL.y, storing h, T_h, and both slopes;asserts that T_h=11-h in both regressions, that the slope without the control equals \bar y_1-\bar y_0 to within 10^{-6}, that both regressions use exactly the same rows, and that the slopes without the control equal those of Exercise 3.
Report the three slopes with the control and explain why they are no longer differences in means.
Exercise 5: One episode
Problem. [core, pencil] Replace the intervention column of the hand table by an indicator that equals 1 at t=5 and 0 at every other date, and keep the rows t\ge2 and the outcomes listed in Exercise 3.
Show that when exactly one of n rows, row \tau, has the indicator equal to 1, the least-squares slope of y_{t+h} on a constant and the indicator is y_{\tau+h}-\bar y_{\text{others}}, where \bar y_{\text{others}} is the mean outcome over the other n-1 rows.
Compute the slope at h=0,1,2 and compare each with \theta_h=0.5^h.
Use the forward equation y_{\tau+h}=\theta_h+\rho^{h+1}y_{\tau-1}+u_{\tau,h} to split the h=0 slope into \theta_0 and everything else. Which term dominates?
Return to the original intervention column (s_t=1 at t=1,5,10,12). As h grows, the regression of y_{t+h} on s_t over rows t\ge2 becomes a single-episode regression without any change to the data. At which horizon does that first happen, and what is the slope there?
Exercise 6: A response in a loop
Problem. [core, computational] The Practicum 01 lab project ships data/raw/onedraw_rho09_seed2.csv, one simulated sample of T=200 periods from y_t=0.9\,y_{t-1}+s_t+v_t with \sigma_s=\sigma_v=1 (seed 2; variables t, s, v, y). Lab 3 of the Shock-to-Response Explorer displays the same observations.
Write a do-file that loops over h=0,\dots,12, regresses y_{t+h} on a constant, s_t, and y_{t-1}, and stores h, \hat\beta_h, and T_h with
postfile.Assert that T_h=199-h, that \hat\beta_0=0.878940 and \hat\beta_{12}=-0.293297 to within 10^{-6}, and state how many of the thirteen estimates lie below \theta_h=0.9^h.
Draw the response graph with \theta_h overlaid and write a caption that names the intervention and its units, the units of the outcome, the horizon unit, and the counterfactual.
In two or three sentences, say what the graph shows about this sample and what it cannot show.
Exercise 7: Many draws
Problem. [computational] Wrap the loop of Exercise 6 in a Monte Carlo experiment. Each sample comes from y_t=\rho\,y_{t-1}+s_t+v_t with y_0=0 and s_t and v_t independent standard normal draws: 300 periods, all 300 values of s drawn before any v (generate s = rnormal(), then generate v = rnormal()), the first 100 periods discarded, so T=200. Set the seed to 3 once for each \rho\in\{0.5,0.9\}, outside the replication loop, and expose the number of replications as global R with a default of 200. In each sample, estimate \hat\beta_h for h=0,\dots,12 with y_{t-1} (199-h rows) and without it, on every row that has the lead (200-h rows).
For each \rho and h, report the mean, standard deviation, and 5th and 95th percentiles of \hat\beta_h with the control, and the mean and standard deviation without it. With R=200, assert that at \rho=0.9 and h=8 the mean and standard deviation with the control are 0.370337 and 0.211226 to within 10^{-6}.
Using the Monte Carlo standard error, the standard deviation divided by \sqrt R, decide at which horizons the mean differs from \theta_h=\rho^h by more than simulation noise.
Compare the spread with and without the control at each \rho. Explain the pattern with the variance of the term \rho^{h+1}y_{t-1} that the regression without the control leaves in its residual.
Where does the sample of Exercise 6 lie relative to the 5–95 percent band at h=8 and at h=12?
Exercise 8: What the residual contains
Problem. [core, pencil] In the AR(1) economy with \theta_0=\sigma_s=\sigma_v=1, the horizon-h residual of the regression on (1,s_t,y_{t-1}) is u_{t,h}=\sum_{j=0}^{h}\rho^{h-j}v_{t+j}+\sum_{j=1}^{h}\rho^{h-j}s_{t+j}.
Write u_{t,1} and u_{t+1,1} term by term, list the terms they share, and derive \operatorname{Corr}(u_{t,1},u_{t+1,1}) as a function of \rho.
Write u_{t,2} and u_{t+k,2} for k=1,2,3. Count the shared terms and compute \operatorname{Corr}(u_{t,2},u_{t+k,2}) at \rho=0.5 for each k.
Explain in one or two sentences why the correlation is zero beyond lag h.
Show that \mathbb E[s_tu_{t,2}\,s_{t+1}u_{t+1,2}]=0, even though u_{t,2} and u_{t+1,2} are correlated.
Exercise 9: First contact with military news
Problem. [data, computational] Ramey and Zubairy’s quarterly U.S. data are in the workbook RZDAT.xlsx, sheet rzdat, from their February 2018 replication package. The course does not redistribute the file; the Practicum 01 lab project ships data/raw/get_rz.do, which downloads it from the authors’ archive, checks its SHA-256, and prints manual download steps if the download fails. The variables you need are quarter (fractional years), rgdp (real GDP) and rgdp_pott6 (trend GDP, the series the authors call potential GDP and estimate as a sixth-degree polynomial trend in real GDP), both in billions of chained 2009 dollars at an annual rate, pgdp (the GDP deflator), and news (military news, billions of nominal dollars).
Run
get_rz.do, import the sheet, keep quarters from 1889Q1 on, and declare quarterly dates.Construct y_t=\texttt{rgdp}_t/\texttt{rgdp\_pott6}_t and s_t=\texttt{news}_t/(\texttt{rgdp\_pott6}_{t-1}\times\texttt{pgdp}_{t-1}). Assert that s_t has 504 nonmissing values.
Estimate the local projection of y_{t+h} on a constant, s_t, and y_{t-1} for h=0,\dots,20, storing \hat\beta_h and T_h. Assert T_h=504-h and explain why the formula T_h=T-h-p, applied with T=504 quarters of news and p=1, seems to predict one row fewer. Report \hat\beta_8, \hat\beta_{10}, and the peak horizon.
On the h=8 estimation sample, compute each quarter’s share of \sum_t(s_t-\bar s)^2 and list the six largest.
Re-estimate the h=8 regression without 1950Q3. Does removing Korea’s news quarter raise or lower the estimate?
Draw the response graph and write its caption. Then write a paragraph of five sentences headed “What has not yet been argued”: one sentence each on units, controls, identification, uncertainty, and dependence on a few episodes.
Exercise 10: Korea is not the average
Problem. [extra, pencil] In the Ramey–Zubairy data, GDP relative to trend was y=0.972500 in 1950Q2, and the news in 1950Q3 was s=0.600073 of lagged nominal trend GDP. Later values of y were 1.000572 in 1950Q3, 1.033931 in 1951Q3, and 1.051212 in 1953Q1. The first-contact local projection of Exercise 9 gives \hat\beta_0=0.080313, \hat\beta_4=0.259141, and \hat\beta_{10}=0.404210.
For h=0,4,10, compute the realized change y_{1950Q3+h}-y_{1950Q2} and the scaled coefficient 0.600073\,\hat\beta_h, both in units of trend GDP.
Which of the two numbers, if either, measures a gap between two paths?
Give three distinct reasons why the two numbers differ, and say what follows if both are taken at face value.
Further Reading
Jordà (2005) introduces local projections and argues for estimating each horizon directly rather than iterating a fitted model forward.
Jordà and Taylor (2025) surveys local projections for applied researchers. Its first example, a Monte Carlo comparison of levels and long differences, returns in Lecture 2; Practicum 01 reproduces its levels curve at a reduced number of draws.
Ramey (2011) constructs the military-news series from narrative sources and explains why the timing of news matters for estimating the effects of government spending.
Ramey and Zubairy (2018) builds quarterly U.S. data back to 1889, with the news series from 1890, and supplies the data of Section 9, which return in Lectures 2, 4, 9, and 13.
Stock and Watson (2018) frames dynamic causal effects in macroeconomics and is the reading for the instrument conditions of Lecture 4.
Montiel Olea et al. (2026) compares local projections with vector autoregressions for applied macroeconomists and prepares Lecture 7.
Inoue et al. (2026) is the course’s second standing reference, on inference for local projections, and is read from Lecture 5 onward.
Lecture Glossary
The glossary collects the bold technical terms introduced in this lecture.
Hover over any dotted-underlined glossary term to see the same definition in place.
- Autoregressive process
- A series whose value each period equals a linear function of its own past values plus a new disturbance. Its coefficient on the past sets how long a disturbance keeps echoing in later values, which makes it the smallest model in which a response has a shape.
- Calendar time
- The date t of an observation, which in a local projection also dates the intervention and the regression row. Estimates at one horizon pool rows from many calendar dates, so a response describes no single episode.
- Causal response
- The difference between the realized and the counterfactual outcome at the same date, written \theta_h when that date is h periods after the intervention. It is the causal estimand of a local projection, defined before any data are used, and a regression coefficient equals it only under assumptions about how the intervention arises.
- Counterfactual
- The path the outcome would have followed without the intervention, with every other disturbance as it actually was. It is never observed, so every causal response compares data with something that has to be reconstructed.
- Estimand
- The population quantity a procedure is meant to recover, fixed before any sample is drawn. For a local projection the causal estimand is the response \theta_h, while the regression targets the projection coefficient \beta_h; the two coincide only under identifying assumptions. Naming the estimand separates two questions that are easily blurred: whether the coefficient a regression targets is the right object, and how close a particular estimate comes to that coefficient.
- Estimation sample
- The set \mathcal T_h of rows in which every variable of the horizon-h regression is nonmissing, with size T_h. Leads remove rows at the end and lags remove rows at the start, so T_h=T-h-p when those are the only gaps and the sample changes with the horizon.
- Horizon
- The number of periods h between the intervention and the date at which the outcome is measured, with h=0 the impact period. Each horizon has its own regression, and the impulse-response function is read along this clock rather than the calendar.
- Impact response
- The response at horizon zero, within the period of the intervention. In the AR(1) economy of Lecture 1 it equals \theta_0, and every later response is a multiple of it.
- Impulse-response function
- The sequence of responses \theta_0,\theta_1,\dots,\theta_H read as a function of the horizon. A single regression coefficient is one point on it, so any claim about its shape involves several estimates at once.
- Intervention variable
- The variable s_t whose effect on the outcome is wanted, named without presuming that it is a shock. The neutral name keeps open the question, argued in Lecture 3, of whether its coefficient can carry a causal reading.
- Lag
- The value of a series k periods earlier, y_{t-k}. It is missing in the first k rows of a sample, so every lag used as a control costs rows at the start.
- Lead
- The value of a series k periods later, y_{t+k}. It is missing in the last k rows, which is why the horizon-h regression loses h rows at the end of the sample.
- Local projection
- A separate regression for each horizon of the outcome h periods ahead on the intervention variable and predetermined controls. Each regression estimates its coefficient on the intervention directly, without iterating a model forward, and under identifying assumptions that coefficient is one point of the impulse-response function.
- Observed shock
- An intervention variable that is measured directly, unpredictable from the past, and independent of the other disturbances that move the outcome. When the intervention is an observed shock and its effects are linear and the same at every date, the local-projection coefficient on it equals the causal response in population.
- Persistence
- How slowly a series returns toward its mean after a disturbance, measured in the AR(1) by \rho. The same impact produces a brief response when persistence is low and a long one when it is high, and high persistence also makes long-horizon estimates noisier.
- Population projection
- The best linear predictor of one variable from a set of regressors in the population, defined by an error that has mean zero and is uncorrelated with every regressor. Its coefficients are what least squares estimates, and it exists whenever the relevant second moments are finite and the regressors are not collinear, whether or not the relationship it summarizes is causal.
- Projection coefficient
- A coefficient of a population projection, such as \beta_h on s_t, the coefficient a local projection targets. It describes a joint distribution and equals the causal estimand \theta_h only when assumptions about how the intervention arises make the intervention unrelated to everything else, beyond the controls, that moves the outcome.
- Realized path
- The sequence of outcomes actually observed, which combines the intervention’s effect with every other disturbance of the same periods. Its change since the date before the intervention is a fact about history, not a measure of the intervention’s effect.
- Regression row
- One dated observation of a horizon-h regression, pairing the intervention and controls at date t with the outcome at date t+h. Rows are dated by the intervention, not by the outcome, so the same date indexes a row at every horizon.
- Response graph
- A plot of estimated responses \hat\beta_h against the horizon h with the units of the intervention and the outcome stated. Its caption names the intervention, the units, and the counterfactual that the vertical axis is measured against, because the curve alone cannot say what it compares.
References
Footnotes
The present value of a stream of future spending is its sum after each year’s amount has been discounted back to the present. A report that raises planned spending for the next three years moves the present value at once, even though the spending itself arrives later.↩︎
Ramey and Zubairy call the series potential GDP and estimate it as a sixth-degree polynomial trend in real GDP. The fit runs over 1889Q1–2015Q4 and leaves out 1930Q1–1946Q4, the Great Depression and World War II; in their workbook the series is
rgdp_pott6. It is multiplied by the GDP deflator when a nominal value is needed. Lecture 2 explains why dividing output and spending by trend GDP puts them in common units.↩︎The agreement that ended the Federal Reserve’s wartime commitment to peg the prices of government bonds, leaving it free to let interest rates rise (Hetzel and Leach, 2001).↩︎
A disturbance is a random term that stands for everything moving the outcome other than the variables written in the equation. In a simulation the computer draws it; in data it is whatever the model leaves out.↩︎
A seed fixes the starting point of Stata’s pseudo-random number generator, so the same commands reproduce the same draws on every run. The course fixes each seed before looking at any result and keeps the draw it produces.↩︎
A burn-in is a stretch of simulated periods that is generated and then discarded so that an arbitrary starting value no longer matters. Starting from y_0=0 makes early outcomes less variable than later ones: the variance of y_t is its long-run value times 1-\rho^{2t}. The simulations draw 300 periods and keep the last 200, and 0.9^{200}\approx7\times10^{-10}.↩︎
A proof by induction shows that a formula holds in a first case and that, whenever it holds in one case, it also holds in the next. Together the two steps cover every case.↩︎
“Best” means smallest mean squared error among all linear combinations of the regressors. Setting the derivative of the expected squared error with respect to each coefficient to zero gives the three conditions in Equation 6. Ordinary least squares solves the same conditions with sample averages in place of expectations.↩︎
Jordà (2005) introduced the name. The method estimates “local projections at each period of interest rather than extrapolating into increasingly distant horizons from a given model,” as a vector autoregression does. Because each horizon has its own regression, errors in a model of short-run dynamics are not compounded at longer horizons. Lecture 7 compares the two approaches.↩︎
With y_{t-1} also in the regression, the same formula holds with s_t-\bar s replaced by the residual from regressing s_t on a constant and y_{t-1} over the same rows. That is the Frisch–Waugh–Lovell result, developed in Lecture 3. In the AR(1) economy the residual is close to s_t-\bar s in long samples, because s_t is unrelated to y_{t-1}.↩︎
After
tsset t,F2.yis the second lead y_{t+2} andL.ythe first lag y_{t-1}. Stata returns a missing value whenever the requested date falls outside the data, andregressdrops every row with a missing variable without comment, so a horizon’s sample shrinks silently.↩︎Stata stores a generated variable such as
vin its defaultfloattype, which keeps about seven significant digits, so 0.9 is held as 0.89999998. The filehand_table.csvwas generated that way, and itsycolumn was computed from the stored values, so exact decimal arithmetic and Stata’s results part company in the eighth decimal place. Reading the file withasdoublekeepsimport delimitedfrom roundingytofloata second time, which would change the eighth decimal at h=1. Declaring bothvandyasdoublewhen the table is generated removes the gap.↩︎At each horizon, the interval between the 5th and 95th percentiles of the 500 simulated estimates. It describes how the estimator behaves when the true economy is known. It is not a confidence interval, which has to be computed from a single sample; Lectures 5 and 6 build those.↩︎
The standard deviation of the estimates across replications divided by \sqrt R. It measures how far a simulated mean could plausibly be from the mean that unlimited replications would give; at \rho=0.9 and h=12 it is 0.224580/\sqrt{500}=0.010.↩︎
A moving average of order h, written MA(h), is a weighted sum of the current and h previous values of an uncorrelated sequence. Its autocorrelations, the correlations of the series with its own values k periods earlier, are zero beyond lag h. “At most” allows for weights that happen to be zero: with \rho=0 and h\ge1, for example, u_{t,h}=v_{t+h}+\theta_0s_{t+h} is uncorrelated with its neighbours.↩︎
Chained dollars measure real output by linking quantity changes between adjacent years and expressing the result at a reference year’s prices, here 2009. They make GDP in different years comparable as quantities, though components measured this way do not add up exactly.↩︎
Ramey (2011) built the series from newspaper and magazine accounts of expected military spending, recording the present value of each change in billions of nominal dollars; the version used here begins in 1890 (Ramey and Zubairy, 2018). Dividing by lagged nominal trend GDP makes the news comparable across a century in which the economy grew many times over. Lecture 2 discusses this scaling, and Lecture 4 uses the news as an instrument for government spending itself.↩︎